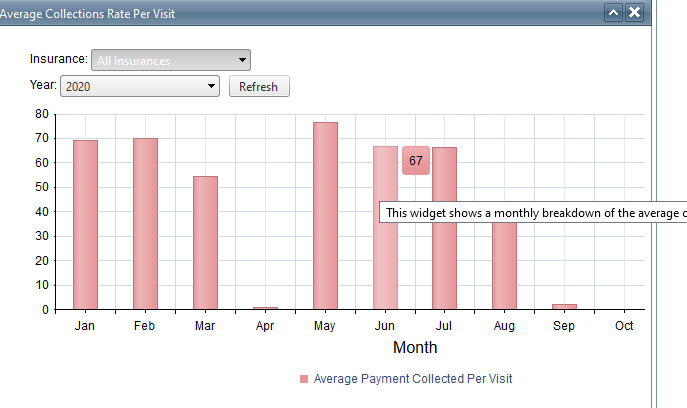
The Average Collections per Visit widget is found on the Financials tab when adding a new widget. This widget shows the trends of revenue coming into the clinic on a per-visit average, month by month. As with all financial data, the further in the past the user is looking, the more accurate the data will be (since there has been a longer window to collect).
This widget totals all payments that have been applied for the clinic location for a particular month’s visits and divides that total by the number of checked-in visits during the same month.
Payments that have been entered into the Financials page but have not been applied to billing codes will not be reflected on this widget. In order to be considered “collected,” the funds must have been applied to a specific billing code.This widget does not have a details page; instead, it offers an Insurance and year drop-down in the top left corner. Clinic users can select different insurances and refresh the widget to see trends by insurance over time.
*Note: Only Insurances marked as “Active” will be displayed in the Insurance drop-down.