The “Visits Per Month” widget shows Checked In, Canceled, No Show, and Pending visits per month.
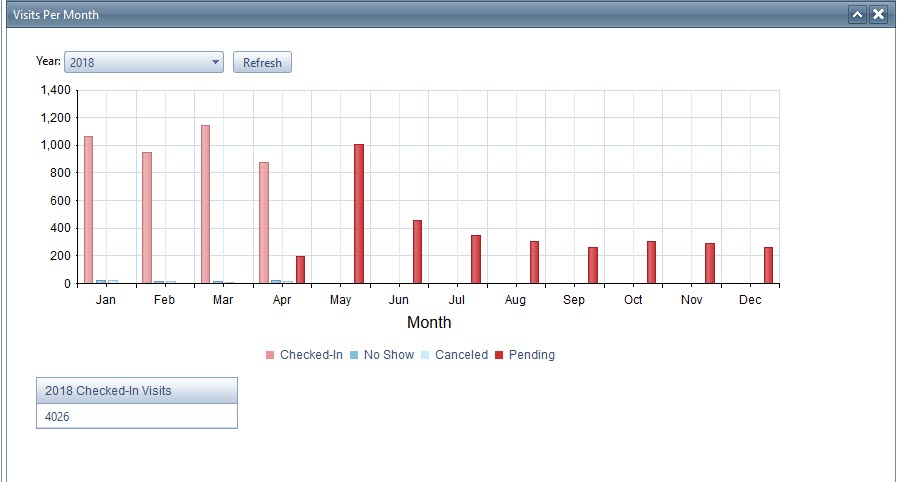
- This graph shows a monthly breakdown of visits. Hovering over the columns on the graph will show numerical data for Checked In, Canceled, No Show, and Pending appointments.
- Note: this widget only counts appointments where the patient name was selected from the drop down in the patient search box. Thus, any appointment time blocked as “unavailable” is not considered as a visit.
- Users can view annual data by changing the drop-down box below the grid; this will show prior years’ data.
- The Details page of this widget defaults to showing all appointments within the past week.
- Users can customize this view to any date range they would like to view.
- Users can also filter Checked In, No Shows, and/or Cancels to show up in or out of the details screen.
- By filtering for No Shows/Cancels within a particular time frame, users can see if an upcoming appointment is scheduled, and call to reschedule appointments from the Details page as necessary.
- The Details page may be sorted by any column or may be filtered using the filter box in the top right. Additionally, clicking on Patient names will link directly to Patient Center.
- The Widget Details are exportable to Excel. The Excel sheet will reflect the date range the user selected for the details page; however, all appointment status types (Checked in, No Show, and Canceled) will show on the Excel. Users can then sort as necessary.